Heatmaps
IT Visibility is being upgraded with the introduction of Technology Intelligence Platform beginning in September 2024. Flexera will contact you directly regarding the timeframe of your upgrade. With Technology Intelligence Platform, out-of-the-box IT Visibility dashboards are being replaced with new, enhanced IT Visibility Technology Intelligence Platform reports. For more information, see IT Visibility With Technology Intelligence Platform Reports.
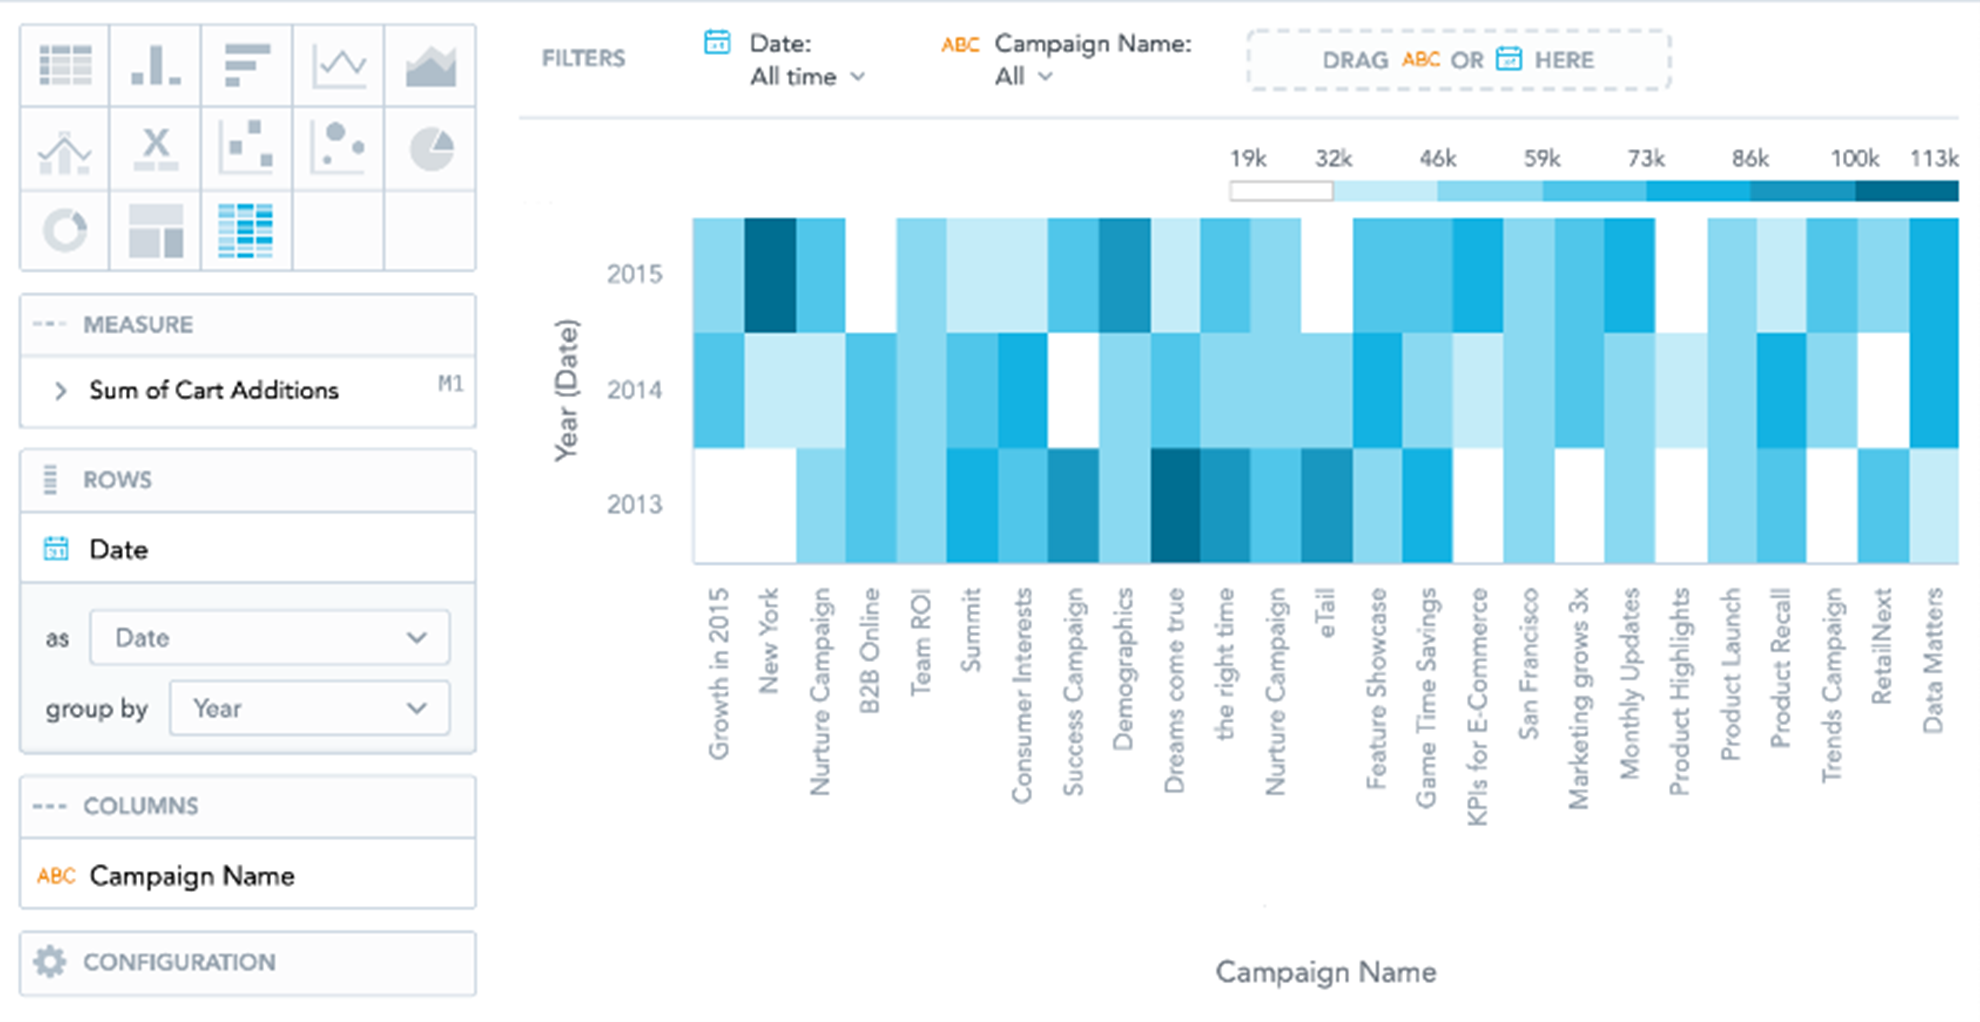
Heatmaps display data as a matrix where individual values are represented as colors. You can use heatmaps to discover trends and understand complex datasets.
Heatmaps have the following sections: Measure , Rows , Columns , and Configuration .
The legend above the heatmap shows the values of individual colors. The higher the value, the darker the color.
Clicking a value in the legend does not hide it from the insight.
For information about common characteristics and settings of all insights, see Insight Types.
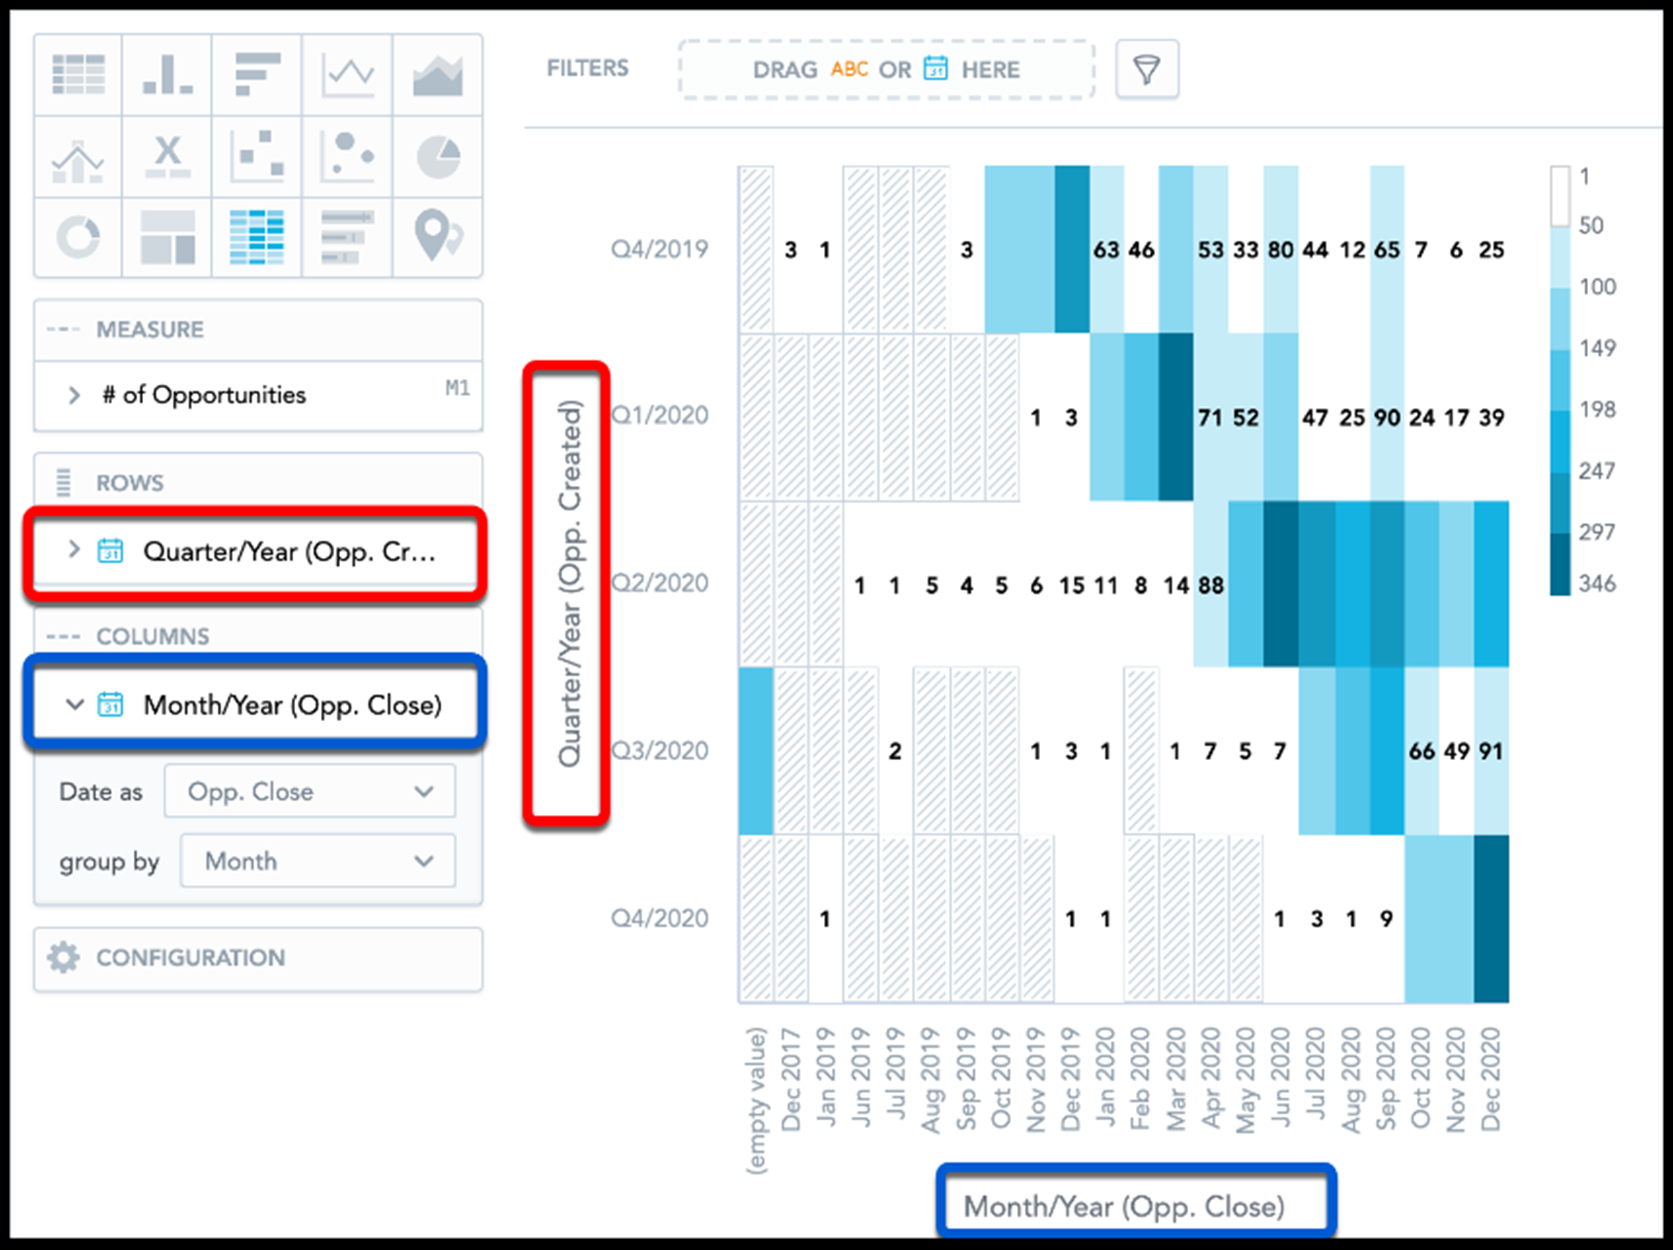
Multiple Date Attributes
Heatmaps support multiple date attributes. When you add a date attribute to Rows and another to Columns, you can select a different date dimension for each date attribute.